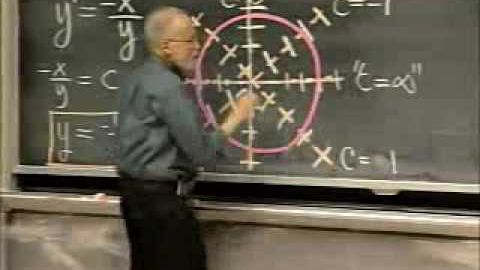
graphs
US
・UK
A2 初級
n. pl.名詞 (複數)用圖表示
All the graphs show a 25% increase in profit, you can see the line going up
v.t.及物動詞圖表
In math class we learned how to graph different math problems
影片字幕
停止說 "再見!"使用這些替代詞替代 "聽起來像本地人"(SOUND LIKE A NATIVE (Stop Saying "GOODBYE!" Use these alternatives to SOUND LIKE A NATIVE)
07:57
- Download my workbook that has a lot of graphs and tables that would help you memorize those alternatives.
下載我的工作手冊,裡面有很多圖表,可以幫助你記住這些備選方案。
【考試技巧】如何分配你考雅思(IELTS)時的時間 (IELTS - How to manage your time)
25:54
- And paragraph three, minor points. Or if you're comparing two graphs, second paragraph, graph
而第三段,小結。或者如果你要比較兩張圖,第二段,圖。
地圖平衡之美 (The Beauty of Map Balance)
08:32
- are some graphs created by Valve from the data that they've collected from popular CSGO
這裡是Valve收集常見CSGO地圖資料 根據平衡性做排列所製成的圖表
為什麼唐納德-特朗普是給民主的禮物? (Why Donald Trump Is A Gift To Democracy)
05:39
- Political science professor John Sides has produced a number of handy graphs
政治學教授John Sides製作出一些易懂的曲線圖
專業化與貿易。經濟學速成班#2 (Specialization and Trade: Crash Course Economics #2)
09:04
- model, but before we go any further, know that economists geek out over models and graphs.
模型,但在進一步說明前,知道經濟學家超級依賴模型跟圖表吧
- the world's shoes, electing instead to import them from countries in Asia. The graphs aren't
世界的2%。都決定從亞洲進口。這些圖表
經濟學入門速成班! (Crash Course Economics Intro!)
01:35
- focus on teaching you the theories and graphs of economics, you know, the textbook stuff.
來教你經濟理論和經濟圖表,就是你知道的,那些課本上的知識
【生涯規劃】專家傳授!如何做一份極完美簡報 (How to Give an Awesome (PowerPoint) Presentation (Whiteboard Animation Explainer Video?)
02:54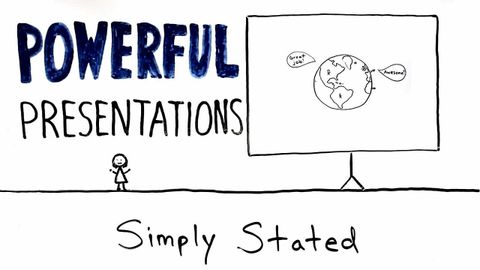
- He always looks for visual ways to tell his story, with supporting images, minimal text, and clear charts and graphs.
他試著尋找著可以以視覺感受的方法去陳述他的故事,以最少的文字、照片和圖表、示意圖。
雙子座 3.0 已洩露:查看運行示例 (Gemini 3.0 has Leaked: See examples of it in action)
10:07
- And so in these graphs you can see that Sonnet 4.5 currently leads the software engineering benchmark test.
在這些圖表中,你可以看到 Sonnet 4.5 目前在軟體工程基準測試中領先。
買房還是租房好?優缺點分析給你看!(Rent or Buy a House?)
04:23
- A summary of the analysis is best illustrated by two graphs.
分析總結使用兩張圖表來說明最清楚。