Placeholder Image

字幕列表 影片播放

  • So please welcome Jake Lowenstern to talk about Yellowstone.

  • For the next hour or so, we're going to talk about Yellowstone.

  • Yellowstone, for those who haven't been there, it's in the northwest corner of Wyoming. About

  • 1000 miles to the northeast of us here. And it's a pretty big park. It's about 9000 square

  • kilometers, or something like 3600 square miles. And for this Bay Area audience it might

  • be useful to look at Yellowstone relative to the Bay Area itself.

  • So that's Yellowstone National Park. The pink line in the middle is the caldera. We'll talk

  • more about that, but the outline of the park is here. So it stretches pretty much from

  • San Jose to San Pablo Bay and from Bolinas all the way over to Pittsburg.

  • It's a big park, and so when we talk about things happening at Yellowstone, you have

  • to think a little bit big.

  • Yellowstone is many things to many people. It of course is the first National Park in

  • the United States and it was the first National Park in the world and it started a trend of

  • humans trying to preserve their wild places for the benefit of future generations, and

  • so Yellowstone is a really special place just from that standpoint alone.

  • Of course it was preserved primarily because of the amazing geothermal features that are

  • there. The geysers.... pressurized boiling waters.... a boiling groundwater system.

  • Its spectacular Rocky Mountain scenery.

  • Its world-class fly fishing.

  • Its charismatic megafauna, as they are known. Lots of animals that have a place to breed

  • because we have such a special large, wild wilderness area for them to hang out in, where

  • they're free from hunters and other problems we often have with our civilized society.

  • Of course, more and more lately Yellowstone is starting to be known as the supervolcano.

  • And along with that we get a lot of crazy publicity, with articles in newspapers often

  • highly exaggerated and very frequently with a great deal of misinformation. So we're going

  • to try and cut through some of that today and see what really has happened at Yellowstone.

  • What's possible at Yellowstone.

  • And we're going to do that starting out with what we know about Yellowstone, and go through

  • a short history of the park and our understanding of the geology and volcanology of it. We'll

  • then talk about the primary geologic hazards and their relative probability. What's more

  • likely than other things? What's actually happening right now? How do we go about monitoring

  • Yellowstone? What are the techniques that we use and what do we learn? And then a little

  • more about the prospects for future activity. And any of those who want to stick around

  • we can do plenty of questions and answers if you're still awake.

  • Originally there wasn't a whole lot known about Yellowstone except the legends of the

  • Native Americans and the tall tales told by the trappers. Jim Bridger here talked of petrified

  • forest with petrified birds singing petrified songs. And he talked about rivers that raced

  • downhill so fast they turned warn on the bottom. But there wasn't a lot of cold hard facts.

  • Congress finally put together a whole series of expeditions to explore the various parallels

  • and Ferdinand Hayden was one of the people who ran the expedition that went through Yellowstone

  • in 1871. These were the groups that eventually got the U.S. Geological Survey started about

  • ten years later. Hayden brought along William Henry Jackson, a photographer, and Thomas

  • Moran, a painter, to help document what they found in the area. They collected samples,

  • they documented what they were seeing, and they did it both through the photography and

  • the painting. Those materials went back to Washington and they were really instrumental

  • in having Congress set aside Yellowstone as a national park.

  • Hayden also figured out quite a lot about the geology. He recognized that this was a

  • volcanic area. And so here as he was looking out from Mount Washburn over the surrounding

  • terrain he said : "..it is probable that during the Pliocene period the entire country drained

  • by the sources of the Yellowstone and the Columbia was the scene of as great volcanic

  • activity as that of any portion of the globe. It might be called one vast

  • crater, made up of thousands of smaller volcanic vents and fissures out of which the fluid

  • interior of the earth, fragments of rock, and volcanic dust were poured in unlimited

  • quantities .... Indeed, the hot springs and geysers of this region, at the

  • present time, are nothing more than the closing stages of that wonderful period of volcanic

  • action that began in Tertiary times."

  • So he recognized that this was a volcanic area. He recognized that it was not TOO long

  • ago in the geologic past that it was active. He put it a little bit older than it actually

  • is, and he also recognized that the hot springs and hot water are in some way related to the

  • volcanic system.

  • He and his colleagues camped on the north side of Yellowstone Lake and they experienced

  • another remarkable thing that we know about Yellowstone that there are a lot of earthquakes.

  • They experienced what we now call an earthquake swarm, where they were awakened in the middle

  • of the night by a series of shocks that woke them up, woke their horse up, and were shaking

  • the trees. And this is a little quote from Albert Peale, one of the people on the expedition.

  • Philetus Norris was the second superintendent at Yellowstone and he had the good fortune

  • of witnessing a hydrothermal explosion... sort of a "geyser gone bad," where rocks are

  • thrown out into the air. And he has a great quote here:

  • "The pool was considerably enlarged, its immediate borders swept entirely clear of all movable

  • rock, enough of which had been hurled or forced back to form a ridge from knee to breast high

  • at a distance of from 20 to 50 feet from the ragged edge of the yawning chasm."

  • So a very alliterative quote. This photo here is the hydrothermal explosion... something

  • that we'll talk later on tonight.

  • And then Thomas Jaggar who later founded the Hawaiian Volcano Observatory, went to a place

  • called Death Gulch, and saw seven grizzly bears that had imbibed a bit of poisonous

  • gas and he wrote:

  • "... the poor creatures are tempted one after another into a bath of invisible poisonous

  • vapor, where they sink down to add their bones to the fossil records of an interminable list

  • of similar tragedies, dating back to a period long preceding the records of human history."

  • These guys knew how to write back then. And they also made a lot of great observations.

  • So we knew that there was a lot of gas coming out at Yellowstone. There's earthquakes there,

  • there's hot springs. It's a big volcanic system. And so the stage was set...

  • It wasn't really though, until the 1960s when a modern perspective on Yellowstone came to

  • pass. This is Bob Christiansen (Chris). He works here. He's retired now, but works out

  • of the USGS in Menlo Park. And he spent much of his career working at Yellowstone. And

  • over here on the right is a picture of a thin section of the Lava Creek Tuff. Tuff is a

  • word for a kind of rock that had been known to be present all around the Western US. In

  • the 1950s, a guy named RL Smith, out of the USGS in Reston started doing a lot of work

  • on this particular type of rock. They're fragmental rocks, and they contain crystals and they

  • contain a lot of glass. And so in this example from Yellowstone, there's a little glass shard.

  • The glass is quenched silicate melt. It's the melt that's present in a volcanic eruption.

  • Bubbles form as gas comes out of solution when the eruption is starting. The material

  • is going into the air and the liquid quenches into glass. The bubbles break and form little

  • glass shards that are swept along in very violent, very hot clouds that fill in valleys

  • and are called "tuff," or called ignimbrite, also called pyroclastic flow. In this case,

  • there's such a thick amount of material that gets deposited and it's so hot, that it starts

  • to weld over time. It condenses. And all the little glass shards tend to get stretched

  • out and aligned. So the glass shards stretch out and you can see they wrap around this

  • crystal that is a much tougher, less pliable material. Anyway, these kinds of rock, the

  • welded tuffs, are evidence of massive volcanic eruptions. And Chris was able to find not

  • just one of these eruptions, which they knew about, but he found that there were three

  • separate eruptions that had happened relatively recently in the geologic past. There was the

  • Lava Creek Tuff that he mapped out in green here. This is a map of how it would have looked

  • 640,000 years ago, right after the eruption of the Lava Creek Tuff. And preceding it was

  • the Mesa Falls Tuff, and before that was another, very, very large eruption, the Huckleberry

  • Ridge Tuff (purple). So the material comes out and moves down valleys and sometimes is

  • many hundreds of feet thick. And it completely fills in this area here, which is called the

  • caldera. Now, in the case of the Lava Creek Tuff, there's a thousand cubic kilometers

  • of material that got taken out of the ground, more or less, during that eruption. That's

  • enough material to bury the State of Texas about five feet deep. So it's a really big

  • amount and it all came out of Yellowstone. So when you take that amount of material out

  • of the ground, and you put it on top of the ground, you're left without a whole lot of

  • support for the ground surface, and it caves in. It's what we call a caldera. It's kind

  • of like a giant sinkhole. These are all the fractures that are associated with the formation

  • of this caldera. And all of this happened 640,000 years ago at Yellowstone. It's the

  • last really large eruption in this particular place.

  • I'm going to really focus in this talk on what the USGS did at Yellowstone, also some

  • other colleagues, but we're here in Menlo Park and I want to focus on some of the work

  • that's been done in this particular location. These guys right here had an amazing time

  • back in the 60s. On the right is a guy named Don White and on the left is his protégé

  • Bob Fournier, who's around and still lives in Portola Valley. We see him pretty frequently.

  • These guys were funded, as was Bob Christiansen by NASA to do studies at Yellowstone. And

  • they got the opportunity to study the geothermal system and to drill 13 science exploration

  • wells into the geyser basins at Yellowstone. First of all, that would be very difficult

  • to get permission to do today, so we're very grateful to them for what they were able to

  • learn, and for the samples that they collected in drillcores. We're able to use them today

  • because they're sitting in a warehouse in Denver. Anyway, these guys wrote a lot of

  • very classic papers on Yellowstone and a lot of what we know about geothermal energy production

  • really came from the work that was done back in the 60s. Here's an example of one of the

  • wells that they were drilling at the time.

  • So the next really remarkable thing about Yellowstone is that it moves up and down.

  • The ground surface is unstable and over time it moves. Bob Smith, who's down here, was

  • one of the party that came in and re-surveyed a series of roads that hadn't been surveyed

  • since the 1920s. Dan Dzurisin also worked on this topic. He's at the Cascades Volcano

  • Observatory, and here he's carrying this tripod that was used for leveling. Well Bob and his

  • colleagues re-occupied the benchmarks that were done previously in Yellowstone, and this

  • is a contour map that shows the number of millimeters that the area had gone up between

  • the 1920s and the 1970s. You can make out 500, 400, 700 is the largest one in the middle.

  • Here's the caldera, and so most of the activity here is going on in the caldera, and the maximum

  • uplift is about 700 mm in between these two areas that we call the resurgent domes, the

  • areas of maximum uplift within the caldera. So 700 mm is 70 cm, it's around 2 feet...

  • and so that had happened in those 50 years. This was really a remarkable observation and

  • something that we've been tracking ever since.

  • Bob Smith by the way, is one of our collaborators at the University of Utah through the Yellowstone

  • Volcano Observatory, and he's been working there on a very, very productive career for

  • many years.  

  • The last topic I want to bring up is the gas flux from Yellowstone, which is something

  • that we didn't know about until about ten years ago, at least in terms of its magnitude.

  • Here are my colleagues Bill Evans and Deb Bergfeld who are trying to figure out how

  • much gas is coming out of this particular pool at Terrace Springs. Over here is Cindy

  • Werner.  She's now at the Alaska Volcano Observatory, but she did her PhD at Yellowstone

  • using this, an accumulation chamber. Here's an example of some more modern ones. These

  • look at the flux of gas through the soil. If you have enough of them and you spend enough

  • time in the field, in her case, many, many summers, going to many places and running

  • grids, she was able to ascertain that a very high flux of gas is coming out of Yellowstone,

  • on the order of 45,000 tons of CO2 every single day. And that makes Yellowstone one of Earth's

  • most prolific natural sources of carbon dioxide, comparable to a pretty big coal-fired power

  • plant.  It's similar to Mount Etna and similar to what comes out of Kilauea in Hawaii.  Basaltic

  • magma, that's the kind that gets formed deep down in the Earth's mantle, contains a lot

  • of carbon dioxide when it comes up towards the surface. So when you see a lot of carbon

  • dioxide, that's a typical thing for a volcano, but its something we didn't necessarily know

  • was happening at Yellowstone, and by seeing that big number we can equate Yellowstone

  • with some of the other big volcanoes on Earth.

  • Let's step back a little bit and try to understand how this works on a larger scale.  This is

  • a map of the Western United States. (Shows Idaho and Wyoming, followed by , Oregon, Utah

  • and Nevada). This is a feature called the Snake River Plain.  Idaho Falls and Twin

  • Falls are there. The Snake River runs through it.  It is very productive farming country.

  •  It's also very flat.  Underneath all that flat terrain is a whole series of old volcanic

  • calderas very similar to Yellowstone.  Around 16 to 17 million years ago there was a rifting

  • in Northern Nevada.  There was the outpouring of the Columbia River basalts in Oregon and

  • Washington and there were calderas forming in northern Nevada, and these numbers, 16,

  • 14, 12, 11, are a progression in the occurrence of these caldera systems that move towards

  • the northeast and towards the present day Yellowstone. So there have been a whole series

  • of Yellowstone-like features that have existed in the Snake River Plain over the last 16

  • million years.  The North American Plate is moving towards the southwest, and so it's

  • overriding an area within the earth's mantle, down 50, 60, 70 kms.  Kilometers by the way

  • are 0.6 miles.  I'm a scientist.  I tend to use the weird metric units a lot, so please

  • divide if I don't translate into English (units).   The plate is moving overtop this melting

  • anomaly in the mantle.  So we have a progression in these caldera systems that get younger

  • and younger toward the northeast, ending up with Yellowstone today.  This is what the

  • Snake River Plain looks like.  This is from the Craters of the Moon. It's very flat and

  • this is what Yellowstone will look like a few million years from now.  Eventually,

  • it's going to cool down.  The land is going to subside, and sink.  We're going to continue

  • to have outpouring of mantle rocks but not as much melting of the upper crust as happens

  • at Yellowstone today.  It will all get buried and flattened, and they'll be growing potatoes

  • on it.

  • This is an example of seismic tomography of the Yellowstone plume or hotspot region.   In

  • this case on top we're looking at the surface of the earth looking out from Yellowstone

  • to California. Yellowstone. Snake River Plain, Basin and Range, Sierra Nevada and Central

  • Valley.  So this is now looking at a slice down into the earth.  The [depth] is in kilometers

  • , 200, so about 100 miles deep.  And the colors represent the velocities of seismic

  • waves that are moving through the crust [earth]. To make these diagrams you are looking at

  • earthquakes that are happening across the globe. And you're looking at which regions

  • the rays from the earthquake are coming in quickly and which ones where they're delayed.

  • And they're able to put together these maps and show that the mantle of the earth beneath

  • the Snake River Plain is slower, the earthquake waves move slower through that region, and

  • that's either because it is hotter, or it's partly melted. And that's not something that

  • you see, for example, beneath the Central Valley.  This is an area that is fairly unique.

  •  We have a lot of melting going on and that ultimately is what is producing basaltic magmas,

  • similar to Hawaii, that are coming up to the surface beneath Yellowstone.

  • Here's another cross section, again where you're looking at depth, where this is to

  • the base of the crust beneath Yellowstone, 40km, something like 25 miles.  You have

  • the basaltic magma, that's liquid.  It's molten rock.  It's coming off the mantle.

  •  It's rising into the crust.  The crust of the earth is less dense and it contains

  • materials with higher amounts of silicon dioxide.  It melts fairly readily.  You mix what

  • melts in the crust with what's coming from the mantle, and you eventually create magma

  • reservoirs high up in the crust that are less dense than the materials coming in from below,

  • and they're also "thicker", more viscous, and much more explosive.  And that's how

  • you get these accumulations of fairly explosive magma up in the crust at depths 5 to 6 miles

  • beneath Yellowstone.

  • OK. So let's talk about some of the hazards at Yellowstone. In this series of slides I've

  • got this blue dot and it's going to move over from low frequency events to high frequency

  • events. Low frequency events might occur every 100,000 or every million years, and an example

  • of those would be the big volcanic eruptions at Yellowstone, these caldera-forming eruptions.

  • There have been three remarkable ones, and there is ash that can be found from these

  • events as far away as Texas. So they're putting ash high up into the atmosphere, into the

  • stratosphere and it comes down a long ways away. So these are big events, but Yellowstone

  • may be done with this particular type of event. There's no reason it ever has to happen again.

  • Volcanoes do live and die eventually. And Yellowstone may have finished the amount of

  • highly silicic melt that it can extract out of the crust. But it is also possible that

  • we could see another one of those eruptions again at some time in the future. In general,

  • they are very, very rare events... not only at Yellowstone, but also around the world.

  • Just to give you an idea of what might happen if this ever did happen again, one of my colleagues

  • at the Cascades Volcano Observatory, Larry Mastin, has done some simple modeling, using

  • wind patterns that we have available to us and tossing ash and replicating the Lava Creek

  • Tuff eruption. In this case, he took wind data from 2006, for a specific week, April

  • 21-27, he put 300 cubic km of material into the air and let it settle out with the wind

  • patterns that were present, and you can get an idea of what would happen. There are some

  • fingers coming out above the Great Lakes. But this color is 1-3 mm. So even though you

  • hear about how these are enormous events, most of the material is falling out either

  • within the caldera or in areas immediately east of Yellowstone. Now you can choose another

  • week and you get a fairly different result. Every possible week that you can have an eruption,

  • you will get a different event. You can't just say: "This will happen," because it depends

  • on how the volcano erupts, the amount of time it takes and the specific wind conditions.

  • In this particular case you get some fingers of 1--3 mm of ash that make it near the Great

  • Lakes, and almost over into New York State. But for the most part, the eastern United

  • States doesn't end up getting a lot of ash even from a giant eruption.

  • These eruptions in the past have a remarkable effect on the landscape. Here are the Rocky

  • Mountains. Yellowstone Lake sits right here. Here's the Yellowstone Caldera. There's the

  • Grand Teton Mountains. You'll see the Tetons march up here. There's all sorts of ranges,

  • the Gallatins, the Absarokas, but there's no big mountain ranges within Yellowstone

  • (caldera) itself. And that's because during these big caldera-forming eruptionsespecially

  • the first one and the third onethe mountains eventually fall into the caldera, and they

  • disappear. And then later on, new lavas come out of the ground and bury the previous landscape.

  • These are big events and they have big impacts. The reason that Yellowstone looks like it

  • does is because of its geological history.

  • OK. This slide shows you the park boundary. It's about 100 km or 60 mi on a side. Here's

  • the caldera, which we've seen several times now. Here in pink are the roads that run through

  • the park. I'm now going to show you everything that's happened at Yellowstone in the caldera

  • since the last caldera-forming eruption (640,000 years ago). All of these are lava flows, in

  • some cases very big lava flows, and they buried the topography and flattened out the pre-existing

  • topography. This is one of the larger ones. It's called the Pitchstone Plateau. It's about

  • the size of Washington, DC. It's anywhere from about 50 to 300--400 feet in thickness

  • and sometimes a little bit more, and it's 70,000 years old. So this is the last volcanic

  • eruption at Yellowstone. Since that time, there has been no volcanism at Yellowstone.

  • But all of these lava flows came out since the last big explosive eruption. A lot of

  • times you'll hear, if Yellowstone erupts... THIS (and they'll talk about the worst-case

  • scenario). But this is what's been going on for the last 30 or 40 big eruptions at Yellowstone.

  • If you've been to the Grand Canyon of the Yellowstone, you were looking at one of these

  • post-caldera lava flows. If something like this came out today, it would be a big deal

  • in Yellowstone National Park. But it wouldn't have a lot of explosive activity, it wouldn't

  • be a national-scale emergency. It would be very much a local event. But it would still

  • be very spectacular.

  • Another thing that's happened since the last caldera-forming eruption is all of these yellow

  • lava flows, and these are all basaltic lava flows. These are the sorts of materials that

  • are created in the Earth's mantle. Normally if they come up beneath the caldera we have

  • all of this silicic magma, the stuff that forms the explosive eruptions. It's high up

  • in the crust and it doesn't allow the deep magma to come up and penetrate through. They

  • pond below, just like in the figure I showed you a little while ago. Outside the caldera,

  • the crust is cool. The rock can break and the basalt can come out and form nice little

  • flows, like you see at the Sheepeater Cliffs, and this is an example of what one looks like

  • in Hawaii. You can imagine what it would be like if it happened at Yellowstone. So these

  • events occur more on the order of every ten thousand years. They actually appear in groupings

  • The last one was 70,000 years ago, so they don't always occur every ten thousand years.

  • There've been about 80 eruptions since the last caldera-forming eruption 640,000 years

  • ago, and the last one was 70,000 years ago.

  • Even more frequent are hydrothermal explosions. This is where the hot-water system that underlies

  • Yellowstone becomes unstable, and the water flashes to steam, throws rocks out onto the

  • surface and can create fairly large holes in the ground. This is called Indian Pond.

  • It's about 1000 feet across. It formed 4000 years ago. There were a lot of these events

  • within the past 15,000 years at Yellowstone. The largest of them forms Mary Bay within

  • Yellowstone Lake. It's two miles across. So if you think about the way that geothermal

  • systems are established... if you drill into a geothermal system, the boiling temperature

  • of water at the surface is 100°C. At Yellowstone, you're at a higher elevation and it's 92°C,

  • or about 200°F. But as you go down in the ground, the pressures increase. The boiling

  • temperature increases, just as it would in a pressure cooker. And so the temperatures

  • once you get a few hundred feet down, are much, much higher than they would be at the

  • surface. So if you're able to depressurize that system, you'll take water that's way

  • above it's boiling point at the new lower pressure, and it'll catastrophically explode

  • into steam, breaking rocks along the way, and forming these very interesting landforms.

  • Here's an example of what one looks like at Biscuit Basin. And this is one that a whole

  • field trip of geologists was witnessing. The park geologist Hank Heasler and Bob Smith

  • from Utah were there to witness this at the time. This is not a big one, but it gives

  • you an idea of what one might be like.

  • And here is a map of where these hydrothermal explosions are located at Yellowstone. All

  • postglacial, so all in the last 15,000 years. A lot of them near the north end of Yellowstone

  • Lake, forming holes in the ground that are fairly large. And so this is a hazard that

  • definitely is present at Yellowstone today, on a more frequent basis than something like

  • a volcanic eruption.

  • Here's another series of slides. These are faults... areas that have broken rock. These

  • are associated with the resurgent domes where the caldera moves up and down. These are associated

  • with tectonic movements associated with the Tetons. And there's also other earthquake

  • faults out in this direction near Hebgen Lake. Here's where a lot of the earthquakes have

  • occurred at Yellowstone over the past 25 years. Just a representative sampling. You'll see

  • there's a lot of earthquakes out hear near Hebgen Lake. And that's probably because it's

  • near the location of the M7.5 earthquake that occurred in 1959, I'll take about in a moment.

  • But there's earthquakes all around the caldera as well. Most of the earthquakes are small.

  • They're magnitudes 1s and 2s. Occasionally 3s. Most of them are not felt. Occasionally

  • there is a big earthquake. And there might be a big earthquake somewhere in the Yellowstone

  • area every 100 to 300 or 400 years. The last really big one was this M7.5 in 1959. It occurred

  • outside the park at Hebgen Lake. It caused a big landslide that buried a campground and

  • killed around 20 people. And here is a slide from Bob Smith showing the offset, the actual

  • scarp that was formed from breakage of this fault was 3 geology students tall... so it's

  • a pretty sizeable earthquake. So this is a geologic hazard that's again much more present

  • in the area than volcanic eruptions. Something that the people living in the area need to

  • be familiar with. And here's some photos from the 1959 earthquake.

  • OK. Monitoring Yellowstone. Well, you've now gotten the picture by now that Yellowstone

  • does have a lot going on. It's an active place. We have a volcano observatory there partly

  • because we feel we need to keep an eye on it, because it does have this big hazard that's

  • a possibility there, but also because it's a globally unique place. There is no place

  • on Earth that's quite like Yellowstone. It has this big magma system. There's contantly

  • things happening. And so we feel it's important that we as scientists know what's going on

  • there and can present that data and can publish it for our colleagues all around the world.

  • Because what we learn at Yellowstone really teaches a lot about volcanoes everywhere.

  • A lot of volcanoes don't do anything. They sit there having no activity at all until

  • about two weeks before they erupt. At Yellowstone we're constantly seeing activity even though

  • it hasn't erupted for 70,000 years. So it's an interesting place to do work.

  • We have a volcano observatory that's set up to look at Yellowstone, and it has eight member

  • institutions. The USGS, who runs the other volcano observatories, but also Yellowstone

  • National Park, the University of Utah runs the seismic network at Yellowstone and has

  • for over 40 years, and they're very active, they receive a co-op through the USGS to work

  • there, there's also the University of (indended to say Wyoming), the three geological surveys

  • of Montana, Wyoming and Idaho, and UNAVCO, which is an organization that runs through

  • a contract from the National Science Foundation to run a lot of geophysical equipment, some

  • of which we have at Yellowstone. So we all work together. It's a virtual observatory.

  • There's no buildings that we have at the park. We go to Yellowstone. We collect data. We

  • have data that's streaming over the internet, that we all get a chance to look at, and you

  • can all look at it too, because it's all available for the public.

  • Here's an example of our seismic network. There's around 30 seismometers spread around

  • the park. When you have a seismic network you're able to locate earthquakes. You're

  • able to find out where they're happening, how deep they're happening and how large the

  • earthquakes are.

  • This is an example of the earthquakes that occurred at Yellowstone last year. There were

  • about 1900 earthquakes. In this case they're sized by the magnitude. So you can see that

  • most of these earthquakes are much too small to be felt. There were maybe 4 or 5 last year

  • that were big enough to be felt. They're color coded by time. And so you can see that different

  • groupings of earthquakes occurred at different times. The blue ones are the earlier ones,

  • such as these by West Thumb. The yellow ones occurred later in the year. Some of these

  • red ones occurred in December. These are all little earthquake swarms. And it turns out

  • that about half of the earthquakes at Yellowstone are in these swarms. They're little groupings

  • of earthquakes. An area might become over-pressurized and the earthquake swarm relieves that pressure,

  • in that particular area. And it's very common. We might get a week that goes by where we'll

  • see 50 or 60 earthquakes in one particular area and then we won't see any more earthquakes

  • for the week after that.

  • Another thing we have is GPS monitoring. These are fancy GPS receivers attached to monuments.

  • We have well over 20 GPS receivers around the park and maintained by UNAVCO. The next

  • data I'm going to show you is from the White Lake area in the eastern part of the caldera.

  • Here you can see one data point for each day. We actually get data out of these things every

  • second. We typically average a day's worth of data, and here you're looking at time from

  • 2005 to 2014. You can see that this particular station was moving west; it was moving south;

  • and so southwest is the direction that all of North America is moving. It's moving along

  • with the rest of the continent toward the southwest. But it's also moving up and down.

  • From 2005 to 2009 or 2010 it was moving up, and in this particular case moved up about

  • 20 cm (8 inches). And then it started going down in this time period here. So the great

  • thing about these GPS receivers is they allow you to look in great detail at one spot. And

  • we have 20 or 30 spots, so we can look at each in great detail and get a feel for day-to-day

  • variations. If something starts happening, you go to the GPS and see if the ground surface

  • is moving up.

  • We have another technique that's called InSAR. It's another satellite-based technique like

  • GPS, and one of the people who works on it is Chuck Wicks, who's a scientist in Menlo

  • Park. And he produced this particular image, and it's called an interferogram. Now InSAR

  • is a radar technique. You have a radar up in space and it's taking an image of the land

  • surface below. It's scanning the land surface. You take an image and compare, in this case

  • it's maybe 1995 to 1997, two years apart, and you're looking at how the ground surface

  • changed in elevation relative to that satellite. And what you get here is like a contour map.

  • Any yellow ring, for example, is going to represent places that moved up a similar amount

  • towards the satellite during that time period. Same goes for this yellow ring or this pink

  • ring. And when the rings are really close together, that means that there was a lot

  • of movement in that particular area. During 1996-2003, there was about 12 cm of uplift

  • over that time period, something like this amount (shows with hands), over an area about

  • 5 miles across. It's a large volume increase, though it dies off when you get to his area

  • out here in the middle of the caldera. So instead of looking a various spots (with GPS),

  • where you might sort of get a feel for what's happening, a map like this really gives you

  • an understanding on a map view of where the ground is deforming, where it's moving up.

  • Another satellite technique that we use looks at heat flow. This is Greg Vaughan who works

  • at the USGS in Flagstaff. He uses the ASTER satellite, and he can specially send it to

  • look at Yellowstone at night when the sun's rays are no longer heating the ground. And

  • can look at those areas that are hot, and those areas that are not as hot. So some of

  • these areas only have a little anomaly and some have a lot of watts per square meter.

  • A lot of energy is coming out of the ground, such as the Sulfur Hills here, or some areas

  • within the Norris Geyser Basin. And so this is another technique that we can do, every

  • ten years or so, to compare if things are changing within the park, and we can also

  • use some other satellite-based techniques as well.

  • Couple other techniques we have. We look at river discharge and temperature. We look at

  • some geyser behavior. We look at geophysical things like tilt and strain. Right here I

  • have a couple images that look at temperature and water flow. In this case, it's related

  • to the eruption of Steamboat Geyser, it's Yellowstone's tallest geyser, sending water

  • over 300 feet into the air. This is close to it in an image from 2005. Last summer Steamboat

  • erupted again. This is from a temperature gage that we have in the outlet, right below

  • the geyser. And here is time on the bottom (x-axis), and right there is when there was

  • a big spike in temperature, a couple hundred feet away from the geyser itself. And you

  • can also find that about a mile away, and an hour later, there was a big pulse of water

  • that went out through a stream gage on Tantalus Creek. So this is discharge here versus time.

  • This peak lines up with this peak. And another neat thing that you can see with this particular

  • diagram is that before the eruption there were all these tiny little peaks, which represent

  • small eruptions of Steamboat sending water maybe 15 or 20 feet in the air. As soon as

  • the big eruption occurred where the water came out for an hour, hundreds of feet in

  • the air, nothing came out of the geyser anymore. So all you see here is a nice flat curve that

  • represents the daily variations in temperature that you would normally measure in any creek.

  • So those are the kinds of things you can learn from data that we have streaming on the internet

  • and that you can look at every day.

  • In the next series of slides I'm going to talk a little bit about what's been happening

  • in the last ten years at Yellowstone... some of the more exciting things that we've been

  • noticing. First one I'm going to talk about is the Denali Earthquake. Then we'll talk

  • a little more about uplift in the caldera. Some of the hydrothermal disturbances at Norris

  • Geyser Basin. And some swarms that occurred in the last few years. This part is a little

  • bit more technical, but try to stay with me.

  • The Denali earthquake occurred in 2002. And it was a magnitude 7.9 that occurred on the

  • Denali Fault up in Alaska. Any time you have an earthquake, especially on a strike-slip

  • fault, you'll get surface waves produced. Those are the ones that do a lot of damage

  • to buildings. And in the case of this particular earthquake it sent big surface waves out in

  • a southeasterly direction. Now every one of these little diamonds here represents a seismic

  • station. And the ones that are red are "pegged out". They're clipped data because the surface

  • waves that were coming from that earthquake were so big, even down in Montana and Wyoming

  • that the seismometers couldn't record the data. There was too much shaking and so it's

  • what we call "clipped." Whereas the blue stations there was a little bit less ground surface

  • wave movement down into California for example. These are figures from a paper by the University

  • of Utah group. Stefan Husen was the main author. And this one over on the right, you don't

  • need to worry about to0 much, but it's calculating the stress level associated with these surface

  • waves.

  • Well when the ground shaking got to Yellowstone, it set off earthquakes all over the place.

  • They were small earthquakes, magnitudes ones, twos and threes, but some of them were felt.

  • And this is a remarkable example of something that wasn't even known about until the early

  • 90s. That is, the phenomenon of triggered earthquakes. That you could have an earthquake

  • at one location and that the waves that are moving around the earth are actually triggering

  • earthquakes at (a distant) location, although much, much smaller earthquakes. And so you

  • can see here, that most of the events were within the first couple hours of the Denali

  • earthquake surface waves hitting Yellowstone. So it also illustrates just how pressurized

  • and ready for earthquakes Yellowstone is, and how easy it is to set off Yellowstone,

  • at least in terms of producing earthquakes.

  • Another thing that happened back around that time was that there was a lot of hydrothermal

  • activity in the Norris Geyser Basin area. There was a new linear vent that formed at

  • Nymph Lake. It formed some really loud jet-like thermal features. A lot of trees died in the

  • area. The Park Geologist Hank Heasler spent quite a bit of time documenting the changes.

  • Later that summer there was a whole region in the Norris Geyser Basin, the Back Basin,

  • where there was anomalous activity in a lot of the geysers, ground temperatures that were

  • increasing and pools that were turning into steam vents or fumaroles. Here's an example

  • of a thermal image taken on the trail. And you can see that some of the temperatures

  • right on the trail were hitting above 50°C. There were measurements right off the trail

  • that were the boiling temperature of water. So if you were walking barefoot, you would

  • have been pretty uncomfortable. But the Park Service closed off the Back Basin for a period

  • of about a month, and things cooled off and went back to normal. A final thing that happened

  • in this time period was Steamboat Geyser. It went off six different times in the period

  • between 2000 and 2005, with most of them happening in 2002 and 2003. Then it went to bed after

  • 2005. It didn't erupt again until this last year. And our colleague Chuck Wicks—I showed

  • that interferogram with the northern part of the caldera that was experiencing uplift

  • he hypothesized that maybe the uplift in that area, there were maybe some magma there at

  • great depth and it was pushing up on the crust, and that causes maybe a little bit of tension

  • at the surface, and maybe that was enough to let more of the deep thermal fluids to

  • get out and cause some of the ground heating and some of these other strange behaviors.

  • And he may well be right, we don't know for sure, but what we do know is that when deformation

  • in that particular area stopped, we stopped seeing a lot of the strange hydrothermal activity.

  • So we probably want to see a few more cycles of this before anyone will believe it, but

  • ... interesting observation.

  • This is another one of these interferograms produced by Chuck Wicks. And it shows you

  • what happened after this area up here stopped rising. The main caldera started to go up.

  • Again we have this bullseye. Maximum uplift is in the center. It falls off as you move

  • to the edge. And the area near the Norris Geyser Basin and the northern caldera is going

  • down from 2004 to 2009. So this part goes up, and the part that had been going up before,

  • now goes down. And this is really an immense amount of uplift, especially when you consider

  • how big the area is, something like thirty miles across. All of that area going up as

  • much as 25 cm or even 20 cm... it's a big volume change, and probably because there's

  • some magma coming into the system at depth and is pushing the ground up a little bit.

  • The uplift went on until around 2009 but eventually it stopped, and one of the interesting things,

  • which has been noticed several times now, is that the uplift often stops when there

  • are big earthquake swarms. The earthquake swarms appear to be relieving the pressure

  • on the system. You have uplift... things are gradually moving up. You have the earthquakes

  • and things start to settle again. These are seismograms. The one on the left

  • is from a station at the north end of Yellowstone Lake and the one on the right is at the south

  • end of the lake. All of the data are for the 27th of December 2008. These are from the

  • Yellowstone Seismic Network. You have time starting from early (at the top) to late (at

  • the bottom). Each 15 minute period is one line. Four lines would be an hour. These are

  • all earthquakes. When you're on a black line the earthquakes are all black. When you are

  • on a red line the earthquakes are all red. Every time you get a squiggle, you are looking

  • at an earthquake. In this particular day.... you have a lot of earthquakes. And the biggest

  • one was a magnitude 4. There was also one M3.5, M2.0, there were a number of felt earthquakes.

  • This happened in December, there weren't a whole lot of people around. Yellowstone was

  • pretty cleared out. There were maybe 15 or 20 people who were living at Lake at the time,

  • and they were feeling many of these earthquakes.

  • It happened for about two weeks. The data were later reduced by Jamie Farrell. He was

  • a PhD student, now finished, at the University of Utah. And here are a couple maps that show

  • you what was happening during that period of time. It turns out that the earthquakes

  • were on a linear trend. The left is a map view. The blue are the early earthquake and

  • the red are the latest earthquakes. They started at the south and they slowly moved north.

  • This is another one of these cross sections. Now you're looking down into the crust, ten

  • kilometers deep. South to the left, north to the right. The biggest earthquake is down

  • at depth. And as time went on the earthquakes moved more toward the north and there were

  • fewer and fewer deep earthquakes.

  • This was a pretty nervous time for us, not only because there were a lot of earthquakes,

  • but also because people get rather agitated when things are happening beneath lakes. Lakes

  • freak people out. You can't see what's going on. You can't see that nothing is happening.

  • And so people hypothesized all sorts of crazy stuff. And it was a nervous time. There were

  • a lot of earthquakes going on, but there were never any steam explosions, never anything

  • happening other than these small earthquakes.

  • Then there was another earthquake swarm and this one was the next year, 2010. In this

  • case, instead of over hear by the lake, we had an earthquake swarm over here on the western

  • side of the caldera, and this was about two and a half times more earthquakes; about 2500

  • earthquakes over a two month period. Most of the earthquakes were within the first few

  • weeks. People didn't seem to get as nervous about this one. Mostly because it wasn't under

  • a lake. And it was under an area that was just a big lava flow. There wasn't anything

  • terribly interesting out there on the Madison Plateau. But it still turned out to be a really

  • interesting series of earthquakes.

  • David Shelly who works here in Menlo Park just published a paper where he used some

  • interesting techniques called waveform-based detection and relocation. Normally if you're

  • measuring earthquakes, you have a big cloud of earthquakes and you can't really make out

  • how they're all related to each other because they're using data from seismometers that

  • are distant from each other. If you really focus on just a couple good sets of data,

  • and you use relative locations, you might not get an accurate location for any particular

  • earthquake, but you can look at their relative locations. So that's what he did. I'm going

  • to show you a movie that represents the earthquakes and there are 8700 events that he's able to

  • detect... way more than you can get with the seismic network itself. You can see that all

  • those earthquakes are aligned on a single fault that's dipping to the east. So they're

  • on a plane. The colors represent different times. The blue ones are early... the 18th

  • of January and the red ones are happening later. You can see there are little "squirts" of earthquakes that are happening along this plane. The thought

  • is that there are fluids that are released on one part of the fault and they lubricate

  • other areas and allow additional earthquakes to nucleate, or occur. So that's a neat example

  • of how some of these things work.

  • Now it's time for questions. I made questions first, 'cause I have questions that I get

  • asked all the time, and I figured I'll just cut to the chase and I'll ask some questions.

  • You can answer questions later on.

  • When will Yellowstone erupt again? Somebody was going to ask that, right? And the answer

  • of course is "we don't really know." It hasn't erupted for 70,000 years, and even when we

  • had these immense hydrothermal explosions back in post-glacial times 5000 years ago,

  • there was never any evidence that any magma was involved. It could erupt. It could erupt

  • next year, but probably not. I don't expect it to erupt within my lifetime. But at some

  • point in time it will erupt. It just might be a thousand or ten thousand years from now.

  • What will the eruption be like? There's an outside possibility that it'll be one of these

  • supereruptions, but that's by no means the most likely scenario. And as I said before,

  • it's perfectly possible that there never will be another supereruption out of Yellowstone.

  • We'll get one somewhere on Earth, but Yellowstone's already had three pretty big eruptions, and

  • most of these volcanoes don't have four or five. They use up all of the crust that's

  • available to melt, and they lose their ability to keep creating really big eruptions. More

  • likely is we'll have more of these big lava flows coming out... using up what magma is

  • down there. But nobody can tell you for sure.

  • Is there enough magma down there to create a supereruption? A supereruption again is

  • one with a thousand cubic kilometers of erupted material. To get a supereruption you have

  • to get all the melt into one place. The magma chamber is like a sponge. It's crystals or

  • rock with the pores filled with the melt. But you can't erupt a magma unless it's more

  • than about 50% melt. Most volcanic eruptions are about 75% melt. All of the images that

  • we have through the seismic tomography tend to predict that there's 10 to 15% melt on

  • a broad basis. We can't really image small areas. So it's possible that there's some

  • highly molten areas down there, but they're probably not enormous. We don't think there's

  • a big enough area (volume) with highly melted regions that could create one of these big

  • eruptions, but there could be smaller areas that could erupt if the right circumstances

  • forced it.

  • Has the magma chamber gotten bigger? This is something that came into the news recently.

  • Our colleagues at the University of Utah have redone the tomography for the magma chamber

  • beneath Yellowstone. And that's something that's constantly going to happen, 'cause

  • we're always getting better data. We have new equipment in the ground. We're able to

  • put things in better places so we have better coverage. And so they were able to find that

  • compared with the last time that they did the tomography they were able to see the magma

  • better. So they got two-and-a-half times more magma than the previous time. The number is

  • still consistent with what we see, the size of the caldera, the amount of heat coming

  • out of Yellowstone. So it's nothing shocking. It means that we can do our job better than

  • we could earlier. And five years from now there'll be a new study that comes out that

  • figures thing out a little bit better. That's the way science proceeds.

  • Will we know it's coming? This is a tough one to say, because nobody's ever seen a supereruption.

  • The last one was 26,000 years ago... and they took really lousy notes. We have seen some

  • relatively large eruptions but the last big eruption on Earth, around a tenth of the size

  • of one of these was the Tambora eruption in 1815. It caused the "Year without a Summer."

  • And that was a very big eruption and would cause a lot of havoc, even though it's only

  • a tenth of the size of one of these Yellowstone eruptions. We don't have a lot of data on

  • exactly know what happens before them. We do know what happens before smaller volcanoes

  • erupt and we know what we think would happen at Yellowstone. And we also have watched what's

  • happening at Yellowstone for a hundred years. We know earthquakes happen all the time. We

  • know that ground deformation happens all the time. They really have to happen on a bigger

  • scale. If we see earthquake swarms, they're going to be big and they're going to have

  • some larger earthquakes to break the rocks up so that we can get magma to the surface.

  • You're going to see ground deformation in the same area that you're seeing the earthquakes.

  • That's something we rarely see, especially significant amounts of ground deformation,

  • on the order of meters of uplift, in a year or so, to show that something's really moving.

  • You're going to see increased gas emissions, and that's going to be obvious no matter what

  • techniques you have. And if magma is getting near the surface it's going to cause steam

  • explosions. Magma hits a boiling aquifer system, boiling groundwater system, it's going to

  • explode. And so you're going to see all of those things happening at the same time. The

  • last time there was a big eruption at Yellowstone, 640,000 years ago there was a whole series

  • of lava flows that came out around the periphery of the caldera before the big eruption. Maybe

  • ten thousand years before. Here we haven't had anything for 70,000 years. I'm not saying

  • for sure we're going to get the exact same thing, and that we can all not worry about

  • it. It just goes to show you that a lot needs to happen before a big eruption.

  • So that's all I have prepared, except to say that we do have a really good website. It

  • has lots of articles, provides a lot of information on what's going on at Yellowstone, all the

  • data that you might want to see. It's really easy to find. You can just google YVO. We

  • also have some fact sheets, these are downloadable, and they're pretty nice six-page and four-page

  • glossy brochures that you can print out for yourself. And they talk about all of the things

  • that I've brought up today.

So please welcome Jake Lowenstern to talk about Yellowstone.

字幕與單字

單字即點即查 點擊單字可以查詢單字解釋

B1 中級

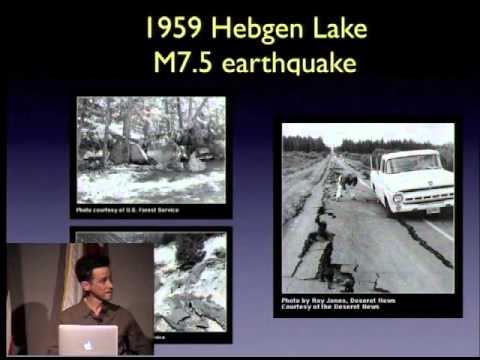
黃石火山。過去、現在和未來 (The Yellowstone Volcano: Past, Present and Future)

  • 101 5
    richardwang 發佈於 2021 年 01 月 14 日
影片單字