
bubble
US /ˈbʌbəl/
UK /ˈbʌbl/
- n. (c.)泡;氣泡
- v.i.冒泡;高漲
B1 中級多益中級英檢更多give up
US /ɡɪv ʌp/
UK /ɡiv ʌp/
- phr. v.失去(希望);放棄(未嘗試就放棄);放棄(中途的放棄);放棄;奉獻自我於(某事)
A1 初級更多go around
US /ɡo əˈraʊnd/
UK /ɡəu əˈraund/
- phr. v.(新聞八卦)流傳;四處走走
A1 初級更多go out
US /ɡo aʊt/
UK /ɡəu aut/
- phr.離開(建築物)
- phr. v.熄滅;不流行;外出;約會;退潮
- v.i.退流行
A1 初級更多have to
US /hæv tu/
UK /ˈhæv tə/
- aux. v.不得不
A1 初級更多in the past
US
UK
- phr.在過去
A1 初級更多in the world
US /ɪn ði wɜrld/
UK /in ðə wɜː(r)ld/
- phr.究竟;世上;絕不;有任何意義
A1 初級更多in time
US /ɪn taɪm/
UK /in taim/
- adv.及時;準時
- phr.及時;準時
A1 初級更多instead of
US /ɪnˈstɛd ʌv/
UK /inˈsted ɔv/
- prep.代替
- adv.寧願
A1 初級更多internet users
US
UK
- n. pl.網路使用者
A1 初級更多laughter
US /ˈlæftɚ, ˈlɑf-/
UK /ˈlɑ:ftə(r)/
- n. (u.)笑;笑聲;歡笑;笑容
A2 初級中級英檢更多live on
US
UK
- phr. v.繼續存在;靠...為生;靠...生活;靠...生活
live up
US /liv ʌp/
UK /liv ʌp/
- phr. v.不辜負
A1 初級更多look at
US /lʊk æt/
UK /luk æt/
- phr. v.查看;看著;看著;檢查
A1 初級更多look upon
US /lʊk əˈpɑn/
UK /luk əˈpɔn/
- phr. v.視為
A1 初級更多move back
US /muv bæk/
UK /mu:v bæk/
- phr. v.撤退;移回
A2 初級更多move over
US /muv ˈovɚ/
UK /mu:v ˈəuvə/
- phr. v.挪動;轉移
move up
US /muv ʌp/
UK /mu:v ʌp/
- phr. v.晉升;向前移動
B1 中級更多of age
US /əv eɪdʒ/
UK /əv eɪdʒ/
- prep. phr.達到法定成年年齡
A2 初級更多of course
US /ʌv kɔː(r)s/
UK /ɔv kɔː(r)s/
- adv.當然
- phr.確信的
- interj.當然
A2 初級更多on equal terms
US /ɑn ˈikwəl tɝmz/
UK /ɒn ˈi:kwəl tɜ:mz/
- prep.在平等條件下
B2 中高級更多on the way
US /ɑn ði we/
UK /ɔn ðə wei/
- phr.在路上
A1 初級更多on to
US /ɑn tu/
UK /ɔn tu:/
- prep.上;知道
- adj.知道
A1 初級更多on top of that
US
UK
- phr.除此之外
A1 初級更多over to
US
UK
- prep.交給;由...負責;到...去
percent
US /pɚˈsɛnt/
UK /pə'sent/
- adv.百分數;百分比
- n. (c./u.)百分比;百分之…;百分之…的增長/減少;百分號;利率百分比
A2 初級多益中級英檢更多population
US /ˌpɑpjəˈleʃən/
UK /ˌpɒpjuˈleɪʃn/
- n. (c./u.)居民;人口;族群;母體;群體
A2 初級多益初級英檢更多poverty
US /ˈpɑvəti/
UK /ˈpɔvəti/
- n. (u.)貧窮;貧乏
B1 中級中級英檢更多rate as
US
UK
- phr. v.評為
B1 中級更多split
US /splɪt/
UK /splɪt/
- adj.分裂的;分離的;裂開的;(比賽)打成平局
- v.t./i.被劈開;被切開;撕裂;使分離;使不團結;分裂:劈開;(平均)分配
- n. (c./u.)分裂;分割;分裂
A2 初級中級英檢更多take off
US /tek ɔf/
UK /teik ɔf/
- phr. v.脫掉;缺勤;模仿;出發;起飛;減少;減輕
- v.t./i.脫掉;離開;開始成功;休假;模仿
- v.i.起飛
A1 初級更多take out
US /tek aʊt/
UK /teik aut/
- phr. v.領取;邀請外出;除掉;去除;取得;外賣
- n. (u.)外賣
A1 初級更多think about
US /θɪŋk əˈbaʊt/
UK /θiŋk əˈbaut/
- phr. v.考慮;想起
A1 初級更多to do with
US
UK
- phr. v.與...有關
A1 初級更多together with
US /təˈɡɛðɚ wɪð/
UK /təˈɡeðə wið/
- prep.與...一起;包括
A1 初級更多united
US /juˈnaɪtɪd/
UK /jʊ'naɪtɪd/
- v.t./i.聯合的:團結的:一致的
- adj.聯合的
A2 初級中級英檢更多up there
US /ʌp ðɛr/
UK /ʌp ðɛə/
- adv.在那上面;在天堂;在頂端
A1 初級更多
Vocabulary
- have to: 不得不
- in the world: 究竟
- up there: 在那上面
- look at: 查看
- of course: 當然
- think about: 考慮
- instead of: 代替
- internet users: 網路使用者
- together with: 與...一起
- live up: 不辜負
- move up: 晉升
- give up: 失去(希望)
- move over: 挪動
- over to: 交給
- take out: 領取
- on top of that: 除此之外
- in time: 及時
- look upon: 視為
- take off: 脫掉
- of age: 達到法定成年年齡
- on equal terms: 在平等條件下
- move back: 撤退
- rate as: 評為
- on the way: 在路上
- in the past: 在過去
- go out: 離開(建築物)
- go around: (新聞八卦)流傳
- to do with: 與...有關
- on to: 上
- live on: 繼續存在
- world: 世界;地球
- split: 分裂的;分離的
- population: 居民;人口
- poverty: 貧窮
- country: 國
- put: 放;放置
- laughter: 笑;笑聲
- bubble: 泡;氣泡
- health: 健康;健全
- percent: 百分數;百分比
- united: 聯合的:團結的:一致的
- south: 南方的
- rich: 有錢的
- income: 定期收入 ; 所得 ; 收入
- America: 美國;美洲
在 App 中使用完整體驗
隨時隨地學習,完整解析句子與用法
01:03
She took a brave step forward, leaving behind her comfort zone to chase her dreams.
單字片語
- brave
adj. 有勇氣的
- comfort zone
phr. 舒適圈
本句說明
a brave step 是名詞片語,其中 brave 是形容詞,修飾名詞 step,表示「勇敢的一步」。
forward 是副詞,修飾 step,表示「向前」。
整個片語作為受詞,回答 took(動詞) 的「什麼」——她邁出了勇敢的一步向前。
在 App 中使用完整體驗
隨時隨地查單字,掌握發音、詞性與用法
brave
US/brev/
UK/breɪv/
adj.勇敢的
v.t.勇敢地面對
A2 初級
在 App 中使用完整體驗
隨時隨地練習口說,立即獲得發音回饋
Try this speaking exercise.
試著跟著這句話練習。
80
【TED】漢斯·羅斯林:用你見過最棒的數據打破第三世界迷思! (【TED】Hans Rosling: Debunking third-world myths with the best stats you've ever seen)
0
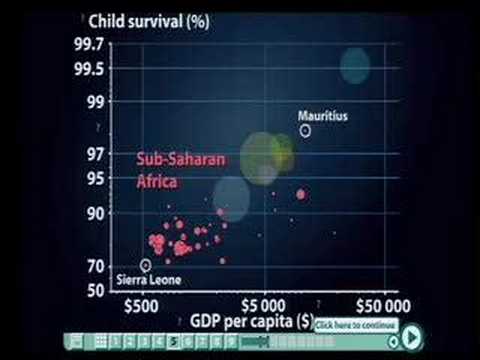
kevin han 發佈於 2021 年 01 月 14 日你是不是也對全球發展的迷思感到好奇?Hans Rosling 用驚人的數據視覺化,破解了許多關於「開發中國家」的常見誤解,同時還能學到超棒的進階詞彙!這支影片是個絕佳機會,讓你一面了解全球健康與所得分配,一面享受引人入勝的演講喔。
在 APP 上學習此影片!
在 VoiceTube App 中有針對影片更深入的練習方式唷!